Download Data
Methods documentation
Three white papers summarize the methods used to develop the data at Wildfire Risk to Communities.
Tabular summaries
Download a spreadsheet with all of the data shown at wildfirerisk.org. This spreadsheet includes data about Risk to Homes, Wildfire Likelihood, and Risk Reduction Zones for all U.S. communities, tribal areas, counties, and states. Tabular summaries are also available for additional data layers via the GIS Files below.
GIS Files
GIS files for all Wildfire Risk to Communities data are available for download by state at the Forest Service Research Data Archive.
See more details about each data layer below. Please contact us if you have questions about downloading and using Wildfire Risk to Communities GIS data.
Data for All Lands
The following data layers are available for all lands in the United States (i.e., “wall-to-wall”). They can be accessed here.
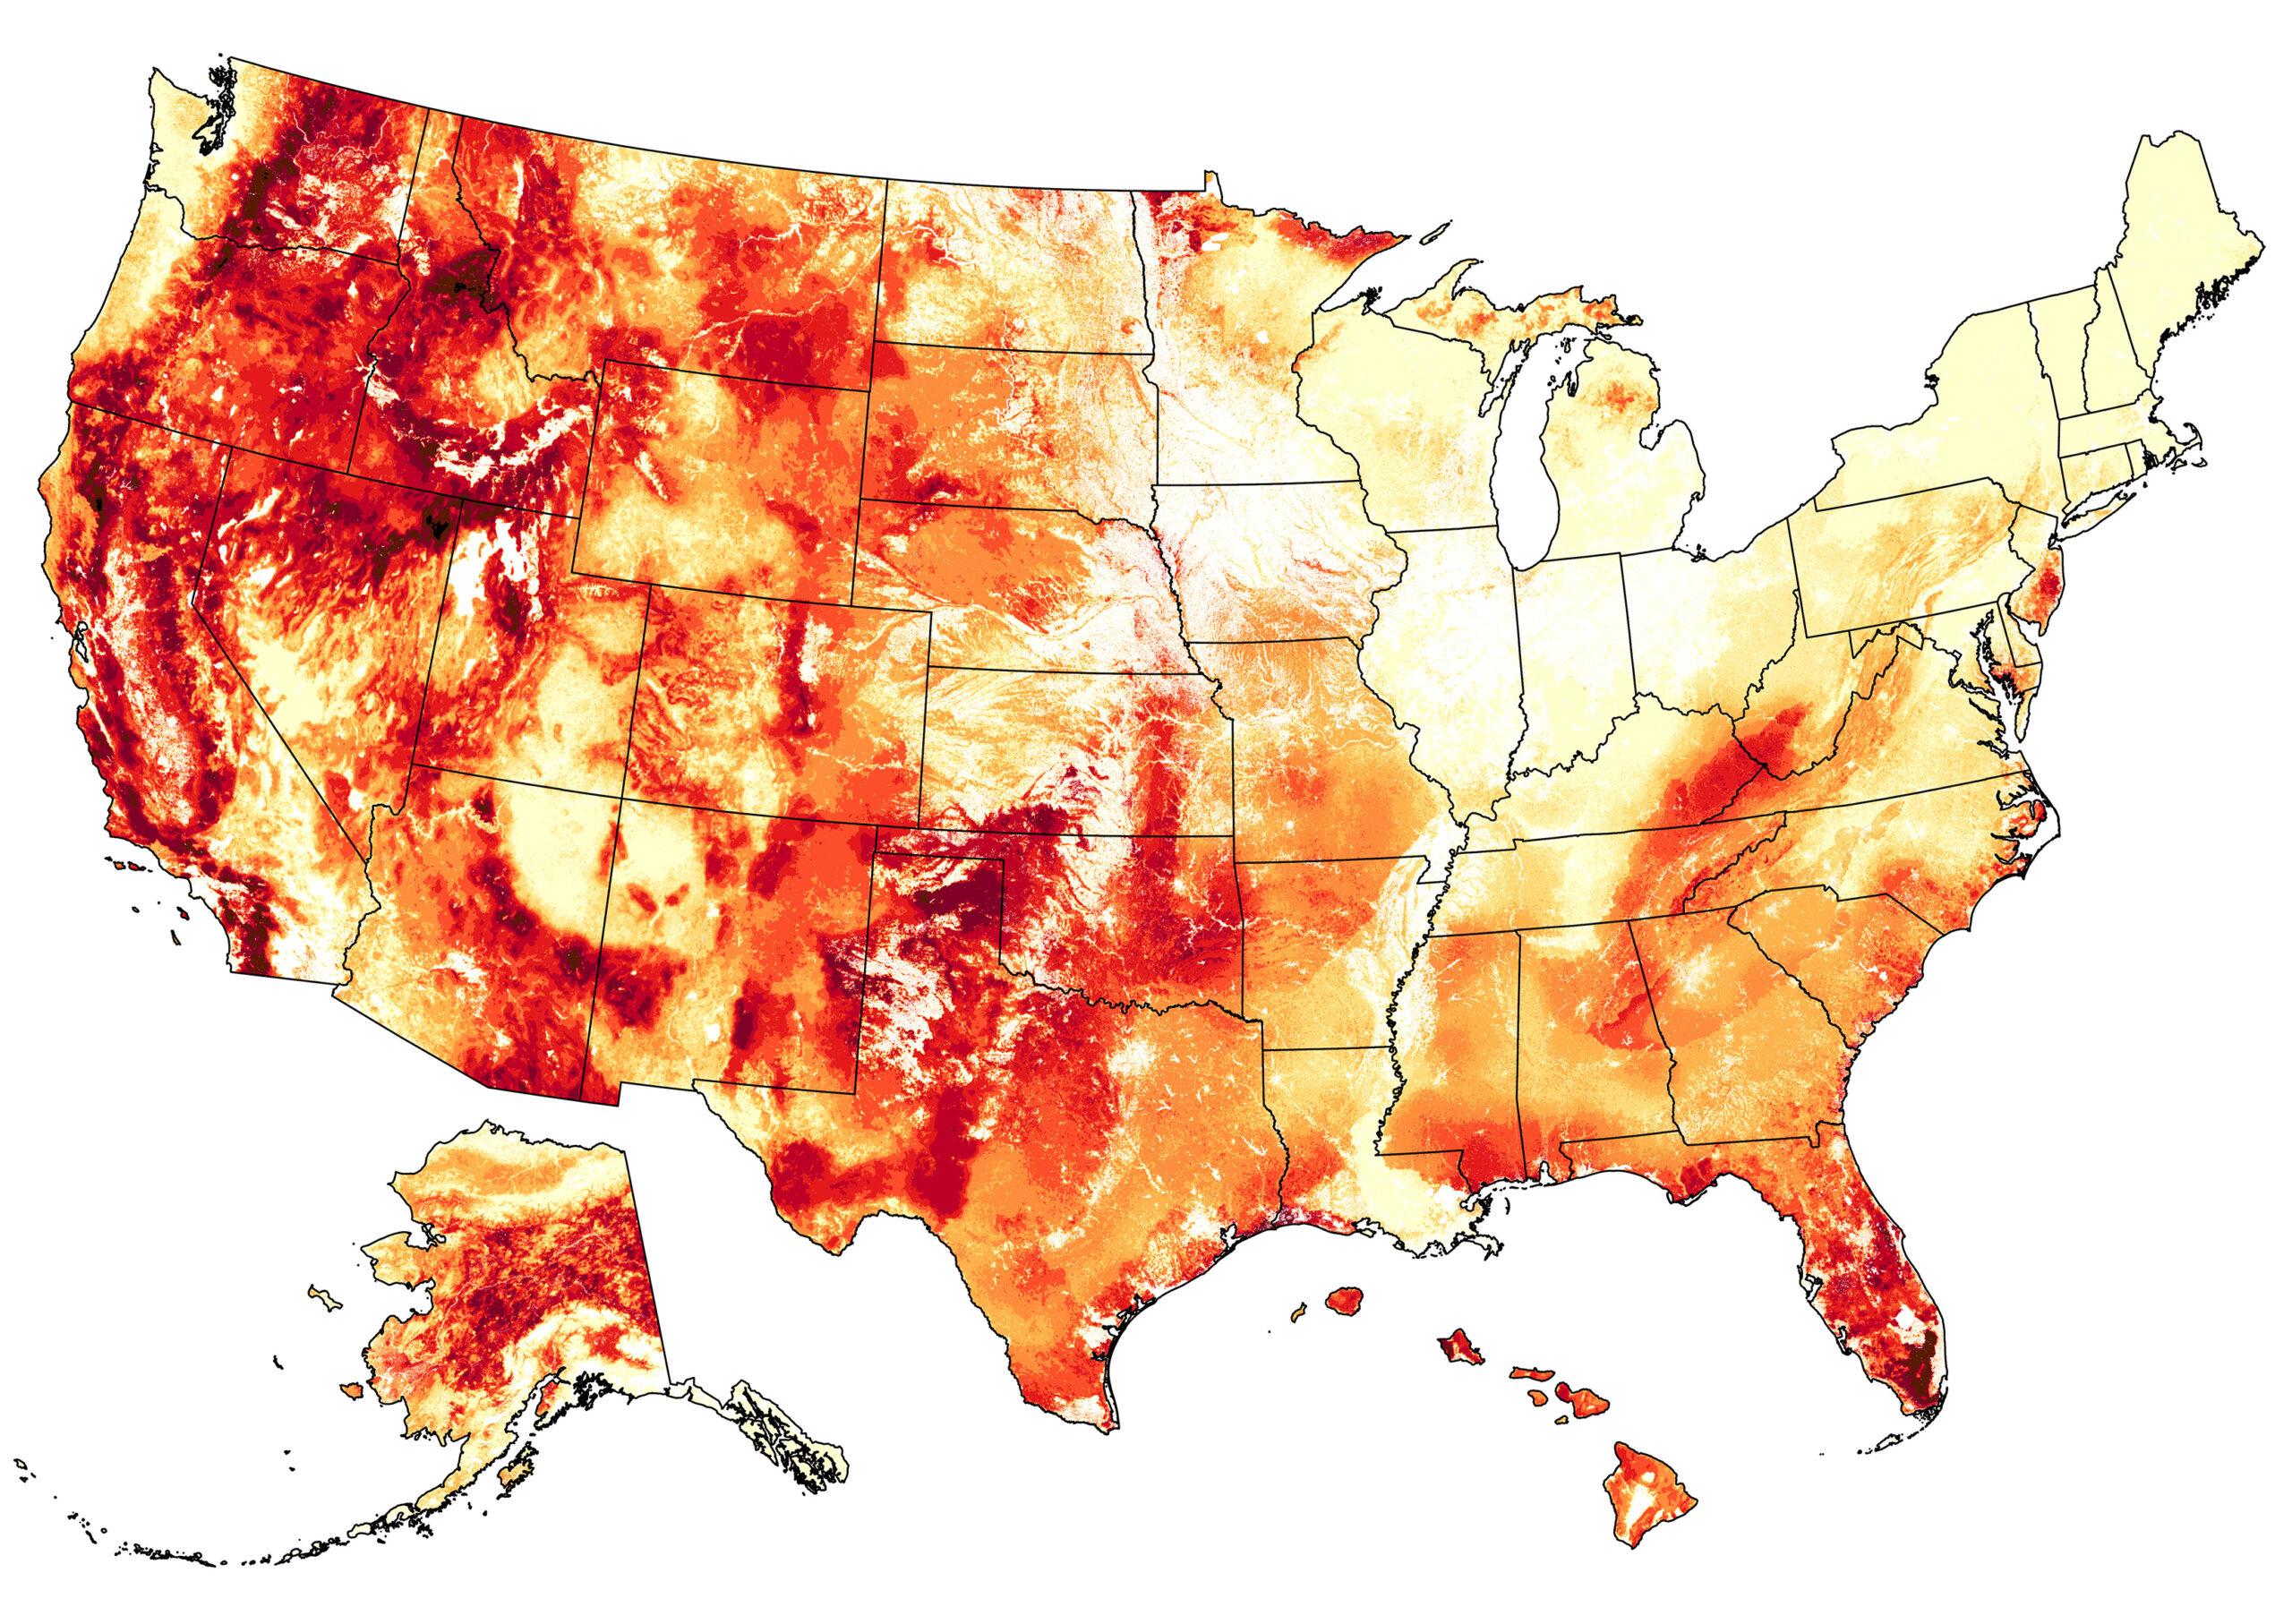
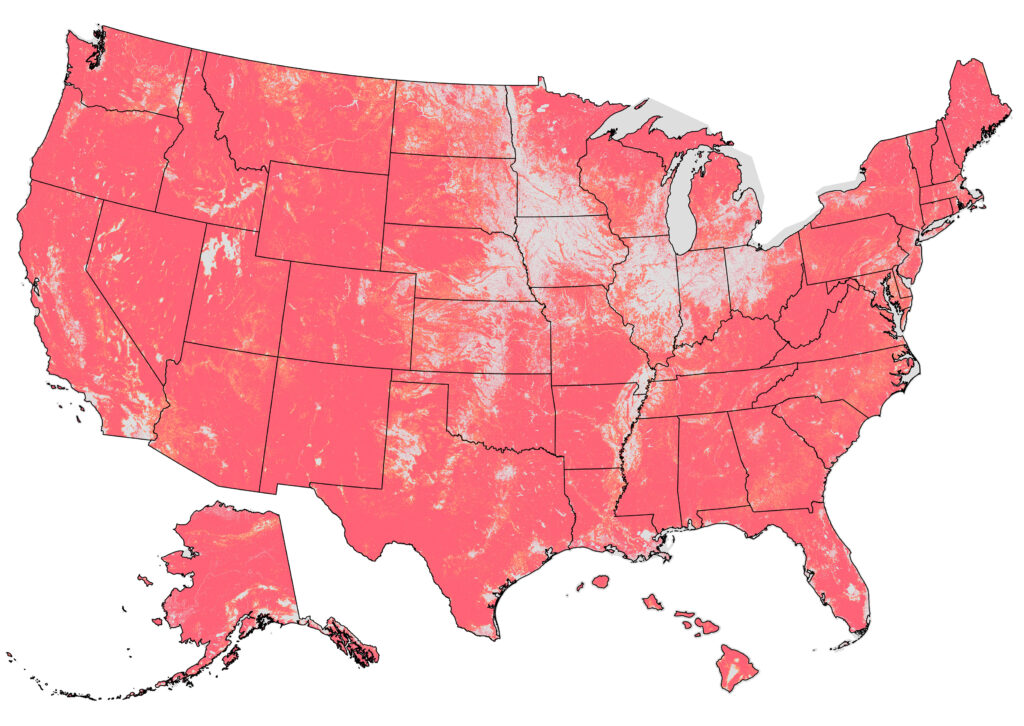
Risk to Potential Structures
(or Risk to Homes)
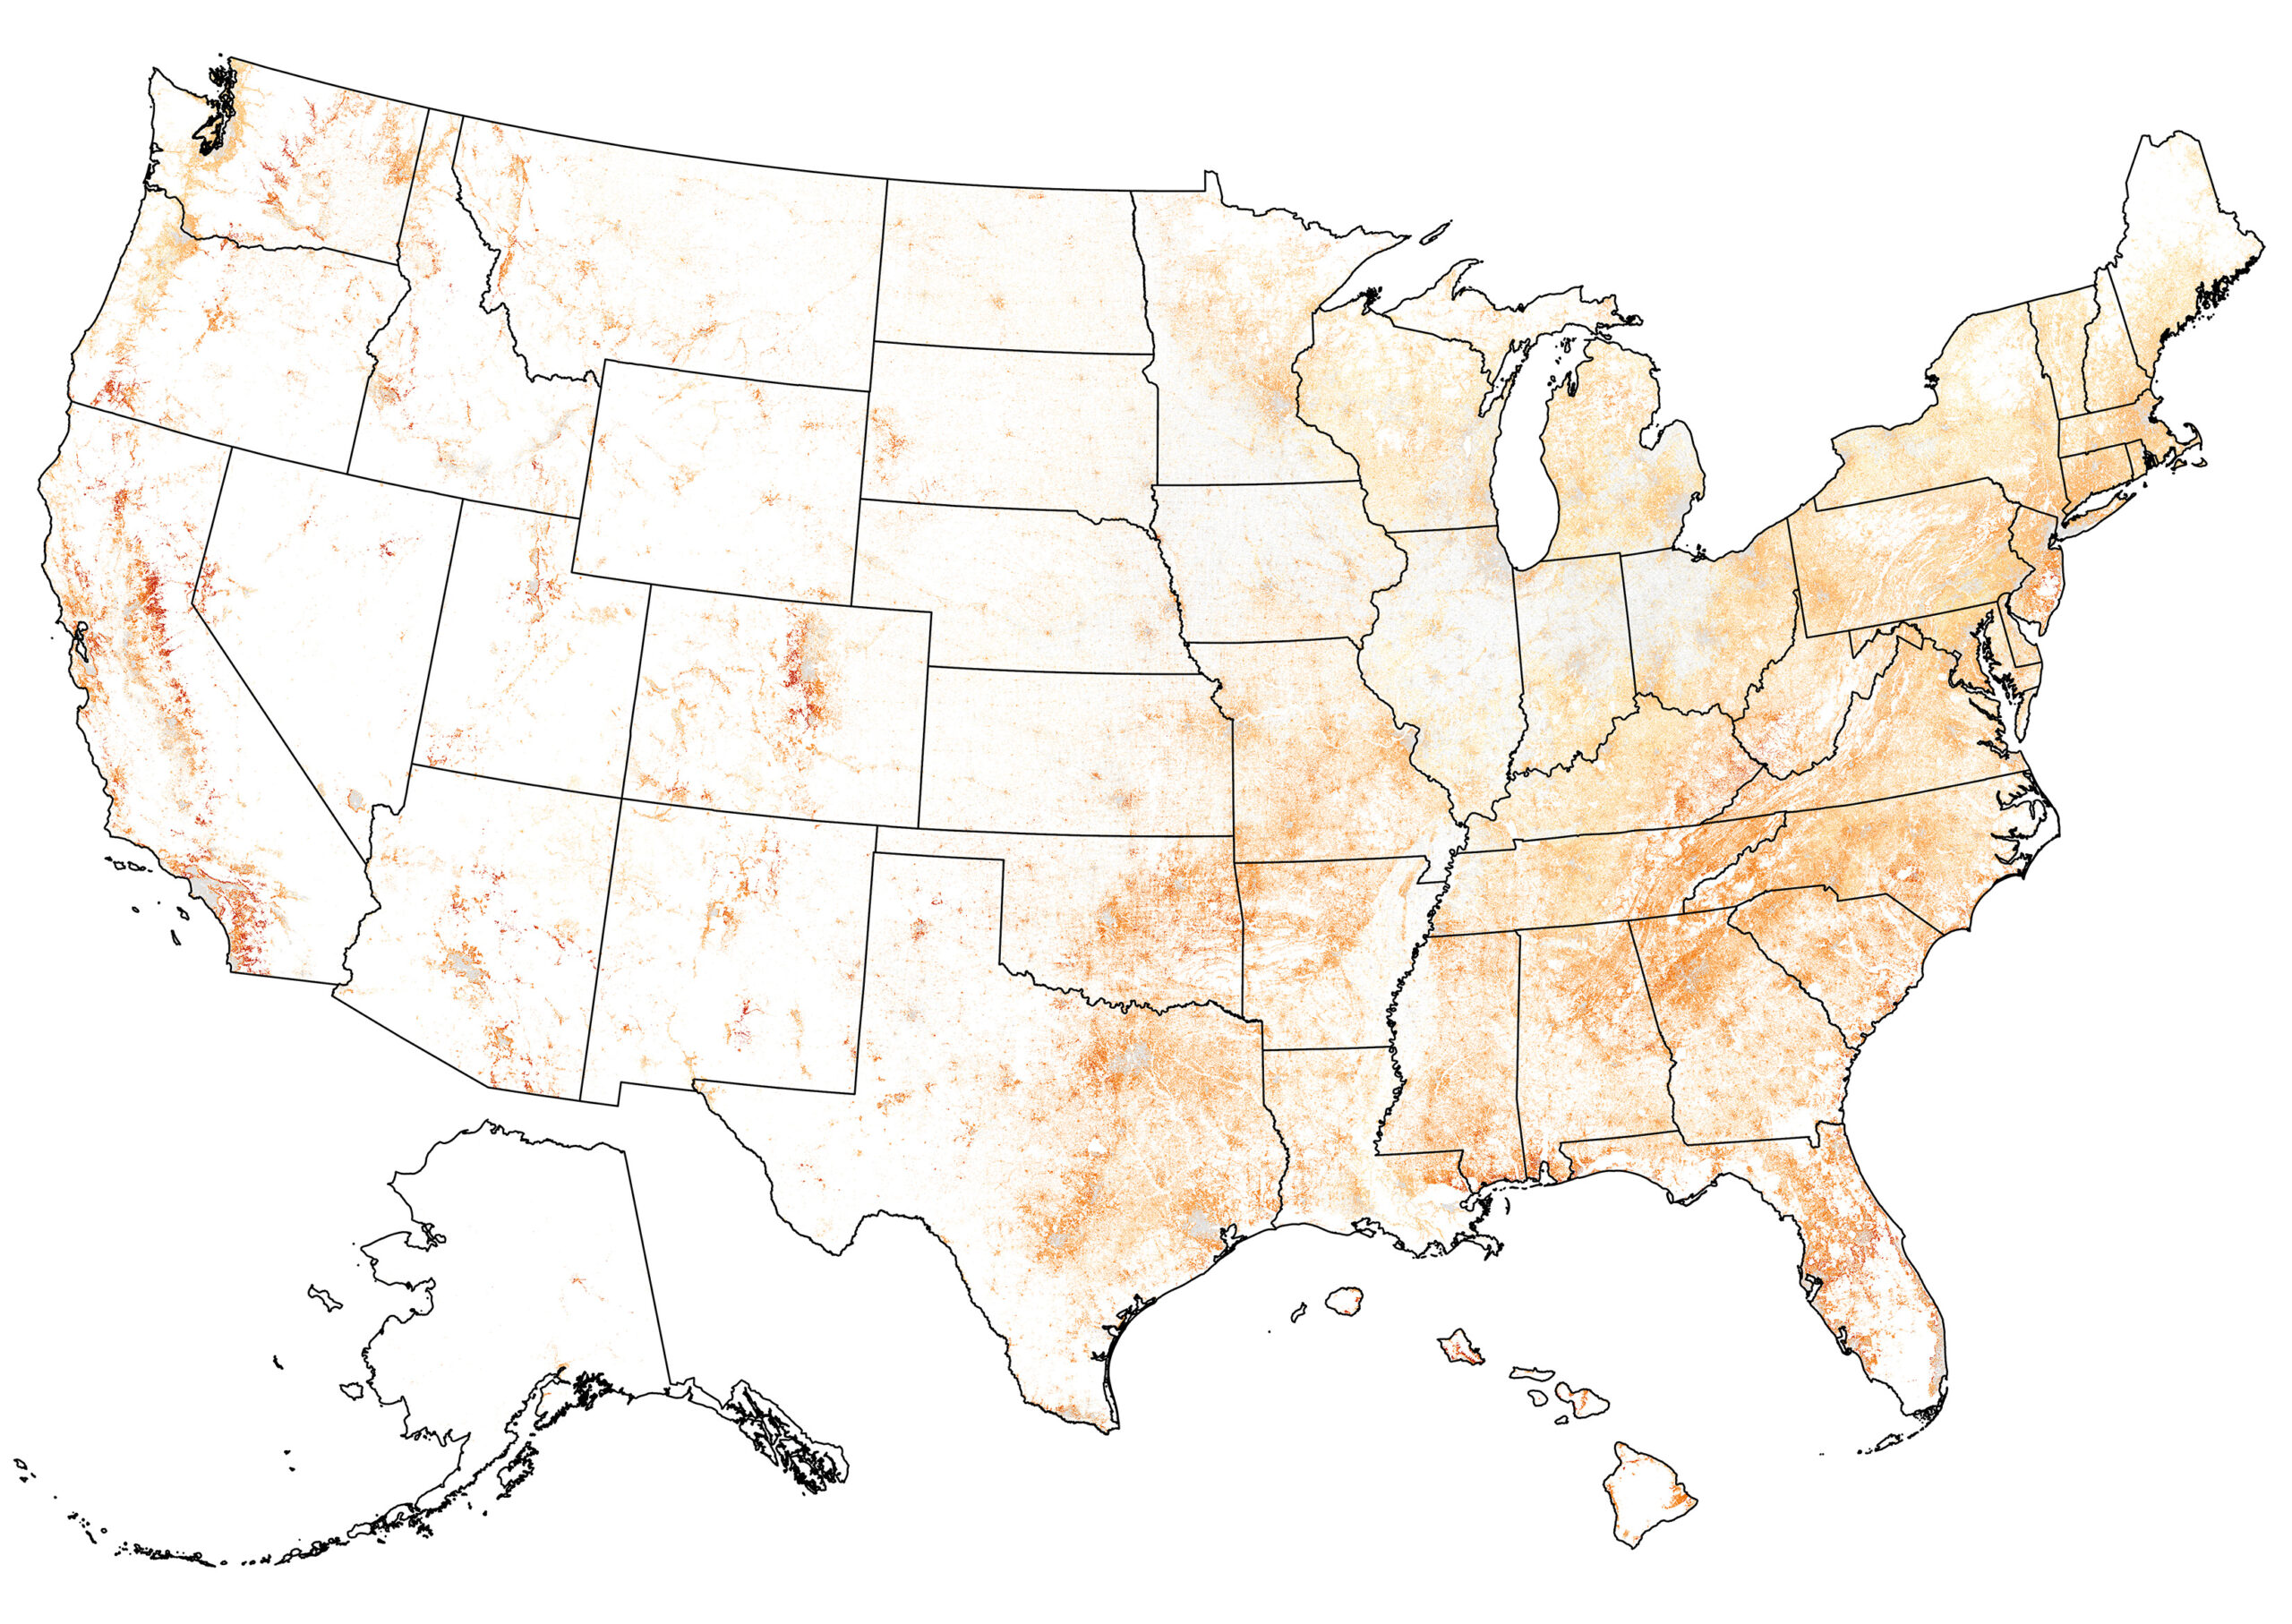
A measure that integrates wildfire likelihood and intensity with generalized consequences to a home on every pixel. For every place on the landscape, it poses the hypothetical question, “What would be the relative risk to a house if one existed here?” This layer is visible as the “Risk to Homes” tab in the Explore section and is available for download in the Research Data Archive.
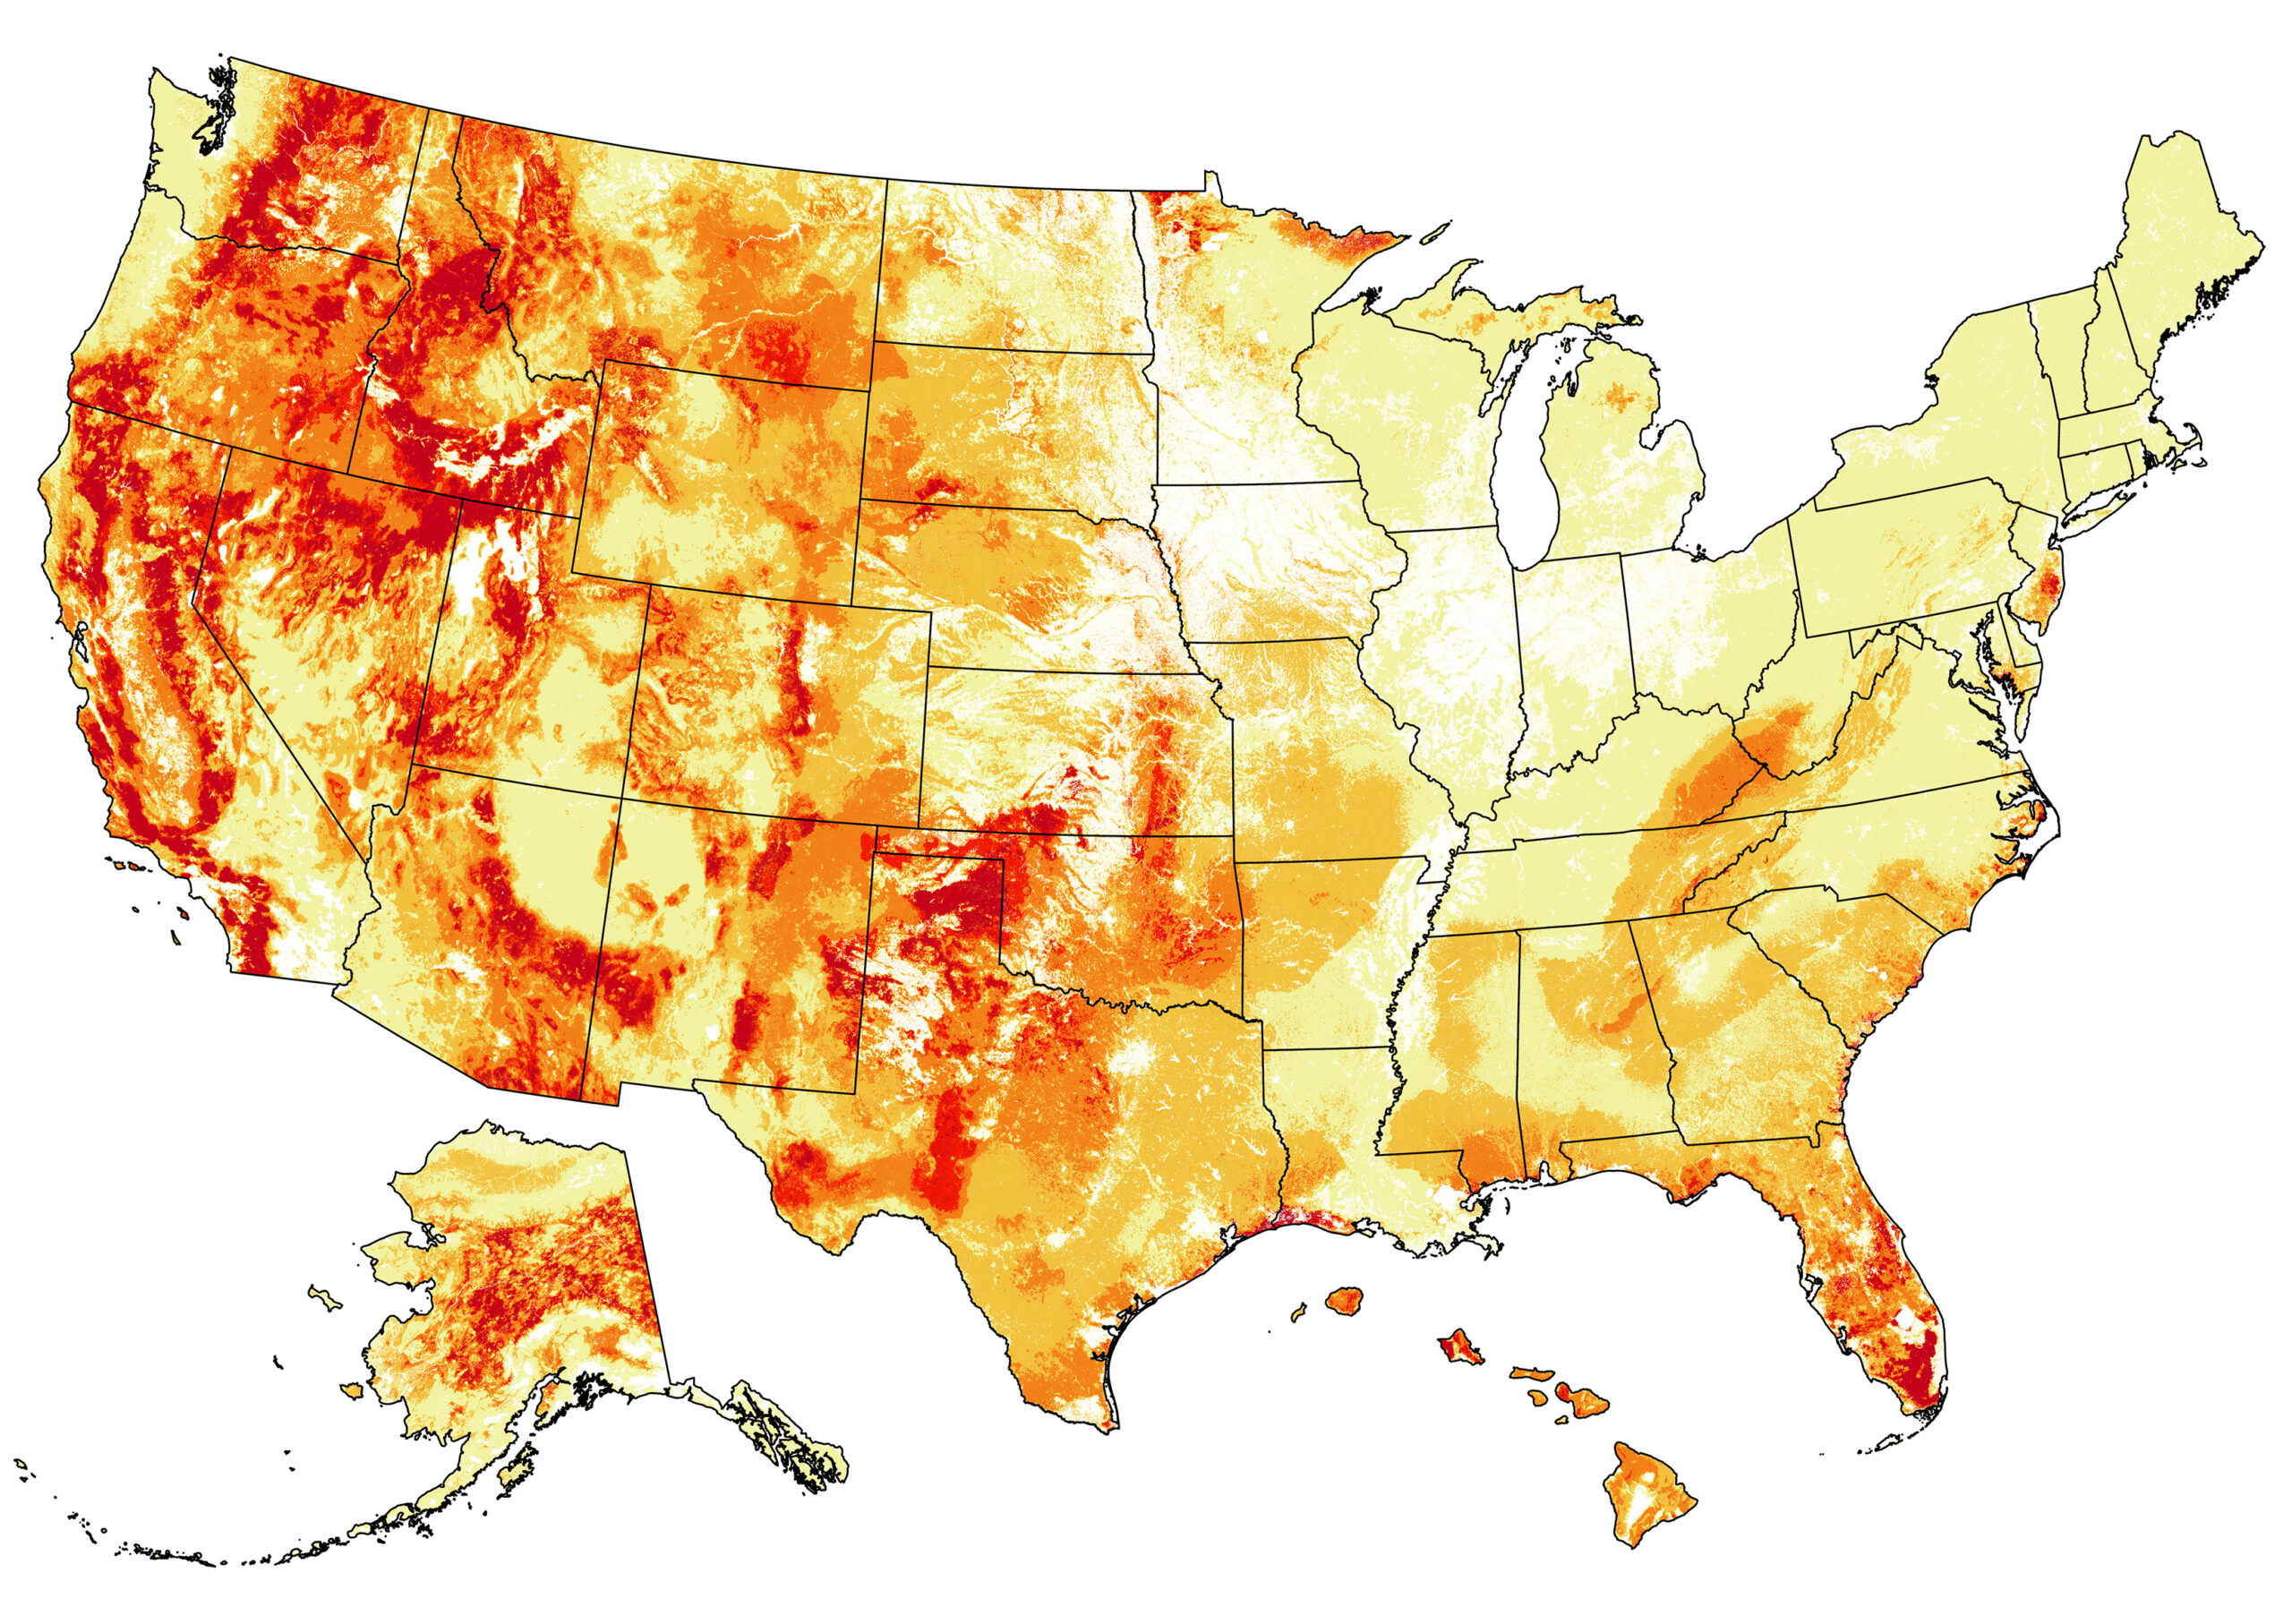
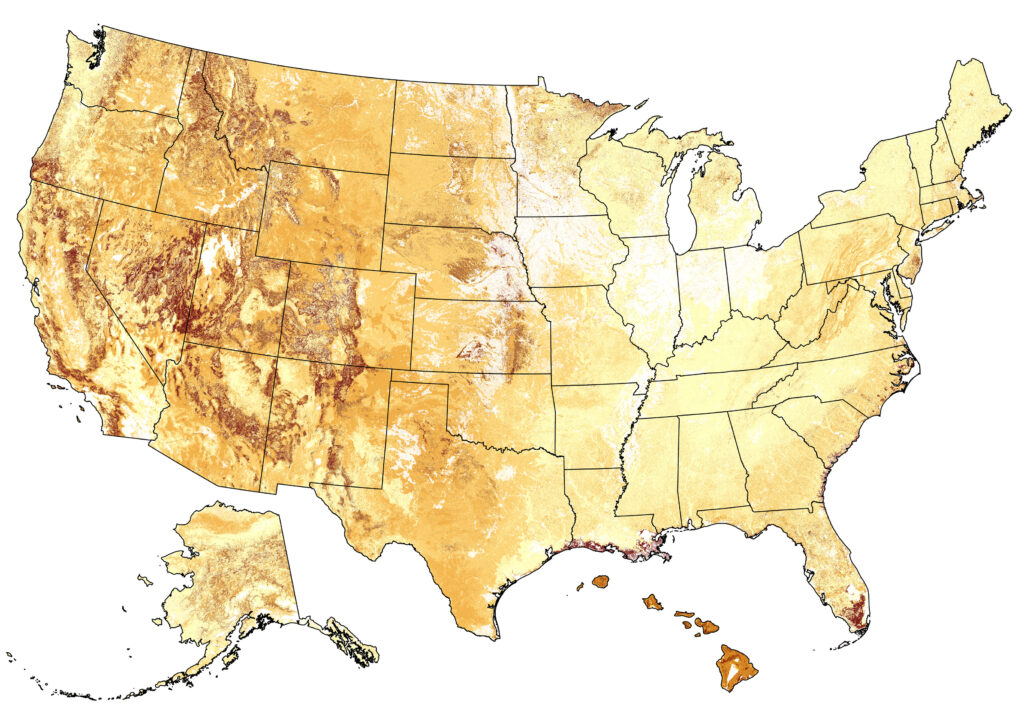
Burn Probability
(or Wildfire Likelihood)
The annual probability of wildfire burning in a specific location. This layer is visible as the “Wildfire Likelihood” tab in the Explore section and is available for download in the Research Data Archive.
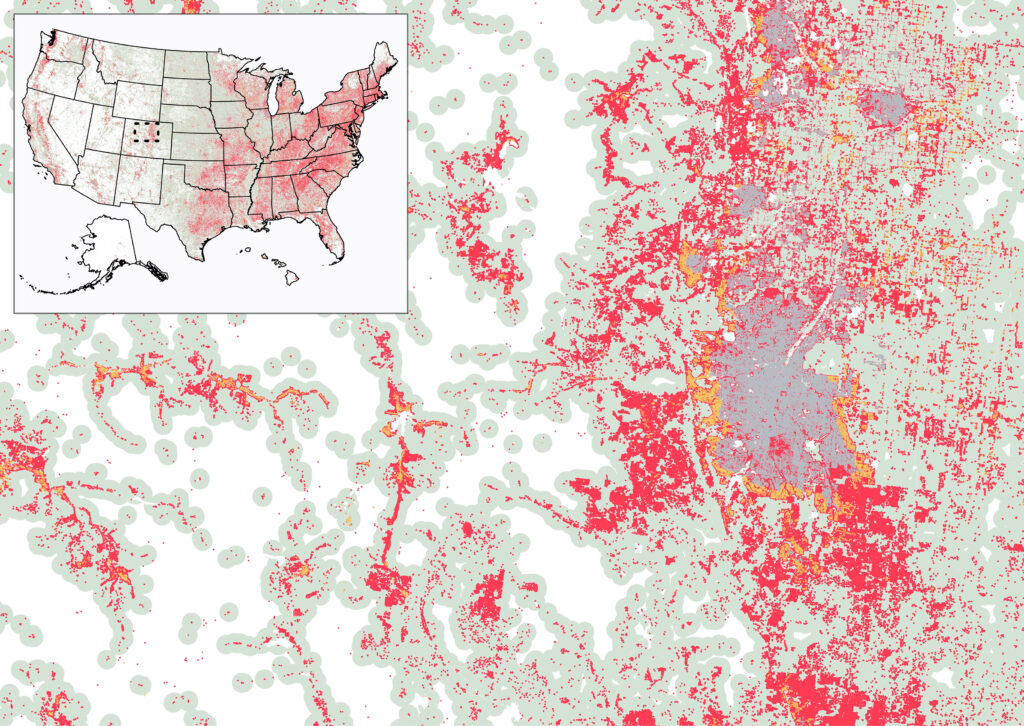
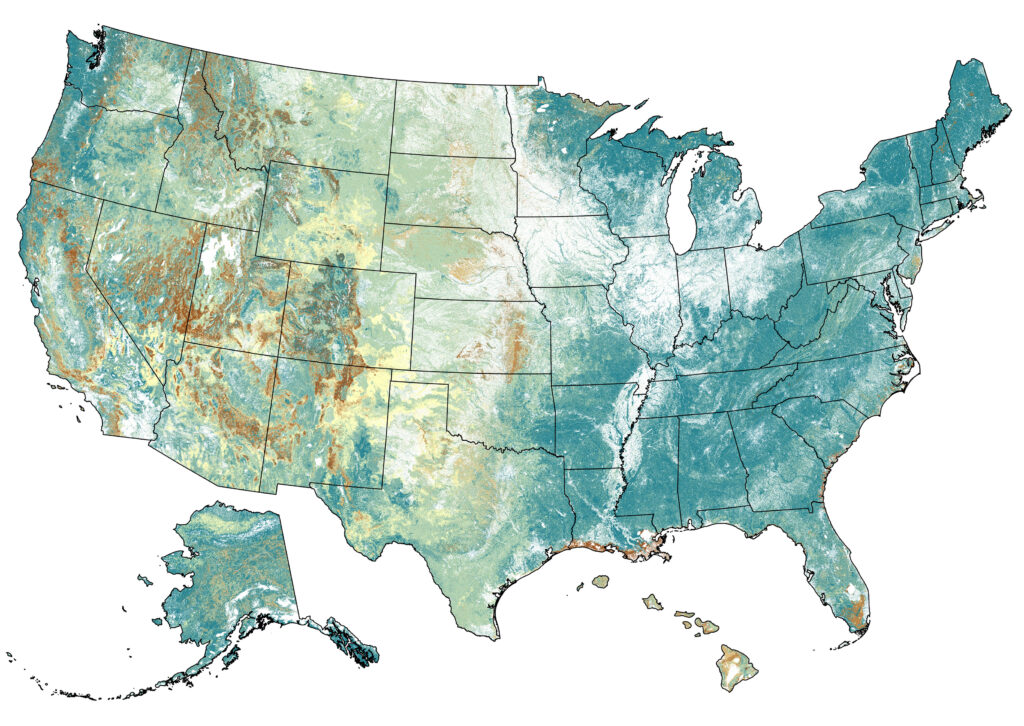
Community Wildfire Risk Reduction Zones
Areas where different types of mitigation activities can be most effective at reducing risk of structure losses from wildfire. Generally, there are four Risk Reduction Zones: Minimal Exposure Zone, Indirect Exposure Zone, Direct Exposure Zone, and Wildfire Transmission Zone. This layer is visible as the “Risk Reduction Zones” tab in the Explore section and is available for download in the Research Data Archive. The downloadable dataset further breaks out the Wildfire Transmission Zone by major fuel categories such as Tree, Shrub, Grass, Agriculture, and Non-Vegetated.
Exposure Type
This layer is used in creating the Community Wildfire Risk Reduction Zones. For every pixel on the landscape, it delineates whether a structure at that location would be directly exposed to wildfire from adjacent wildland vegetation, indirectly exposed to wildfire from indirect sources such as embers and home-to-home ignition, or minimally exposed to wildfire due to distance from direct and indirect ignition sources. Get this layer in the Research Data Archive.
Flame Length
There are three layers with information about flame length, a measure of wildfire intensity. Get these layers in the Research Data Archive.
- Conditional Flame Length: Most likely flame length at a given location if a fire occurs, based on all simulated fires; an average measure of wildfire intensity.
- 4ft Flame Length Exceedance Probability: Probability of having flame lengths greater than 4 feet if a fire occurs; indicates the potential for moderate to high wildfire intensity.
- 8ft Flame Length Exceedance Probability: Probability of having flame lengths greater than 8 feet if a fire occurs; indicates the potential for high wildfire intensity.
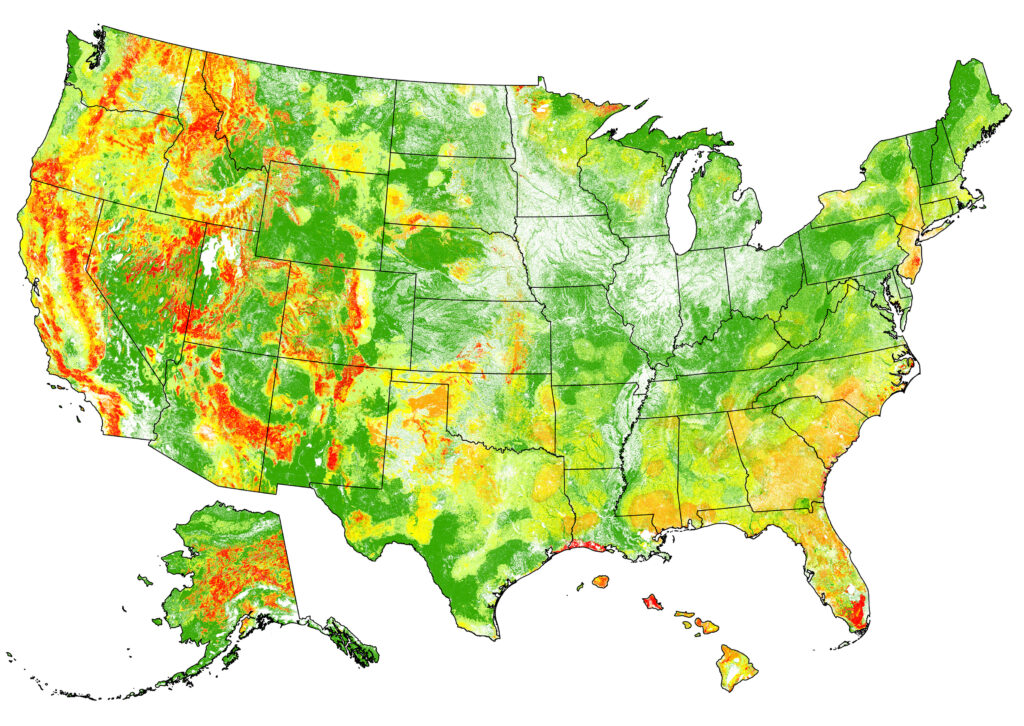
Wildfire Hazard Potential
An index that quantifies the relative potential for high-intensity wildfire that may be difficult to manage, used as a measure to help prioritize where fuel treatments may be needed. This layer integrates wildfire likelihood and intensity, but does not include generalized susceptibly of homes. Get this layer in the Research Data Archive.
Conditional Risk to Potential Structures
(or Wildfire Consequence)
The potential consequences of fire to a home at a given location, if a fire occurs there and if a home were located there. This layer integrates wildfire intensity and generalized susceptibility of homes, but it does not include wildfire likelihood. Get this layer in the Research Data Archive.
Data for Populated Areas
The following data layers are available for populated areas in the United States. They can be accessed here.
Population
There are two layers with information about population, according to U.S. Census Bureau datasets as of 2021. Get these layers in the Research Data Archive.
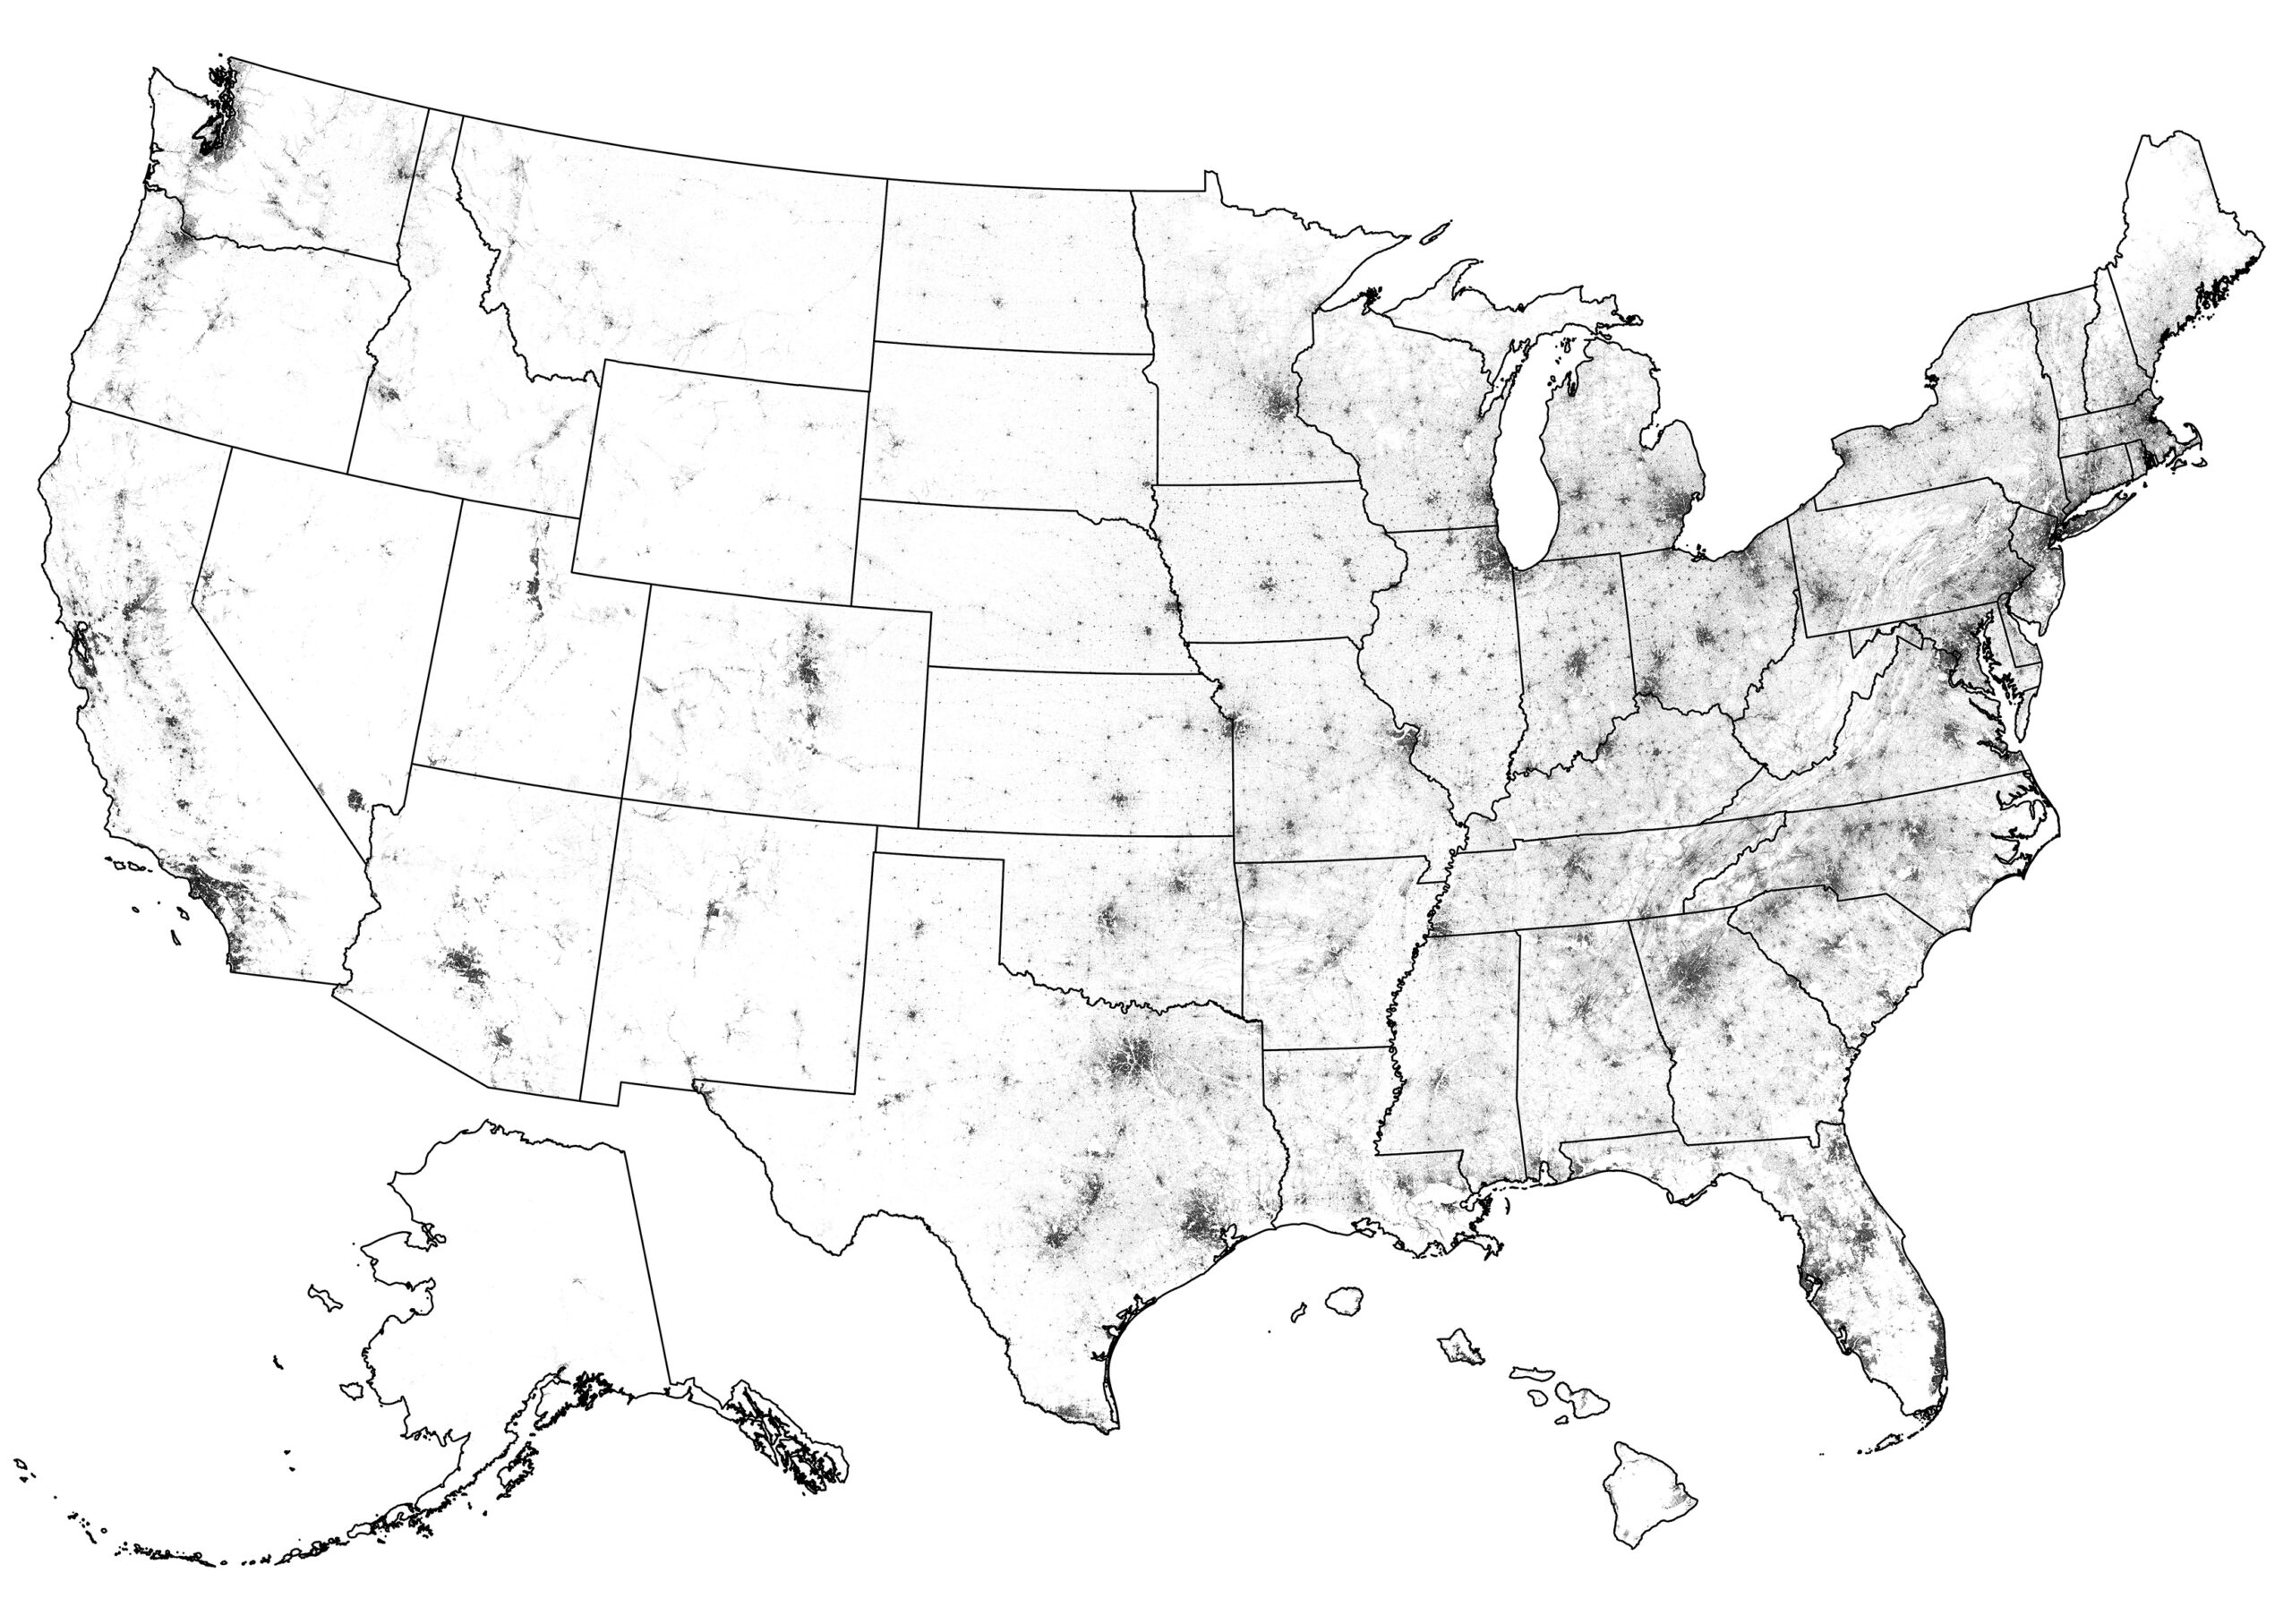
- Population Count: The approximate number of people living in each 30-meter pixel. No spatial smoothing is applied to this layer.
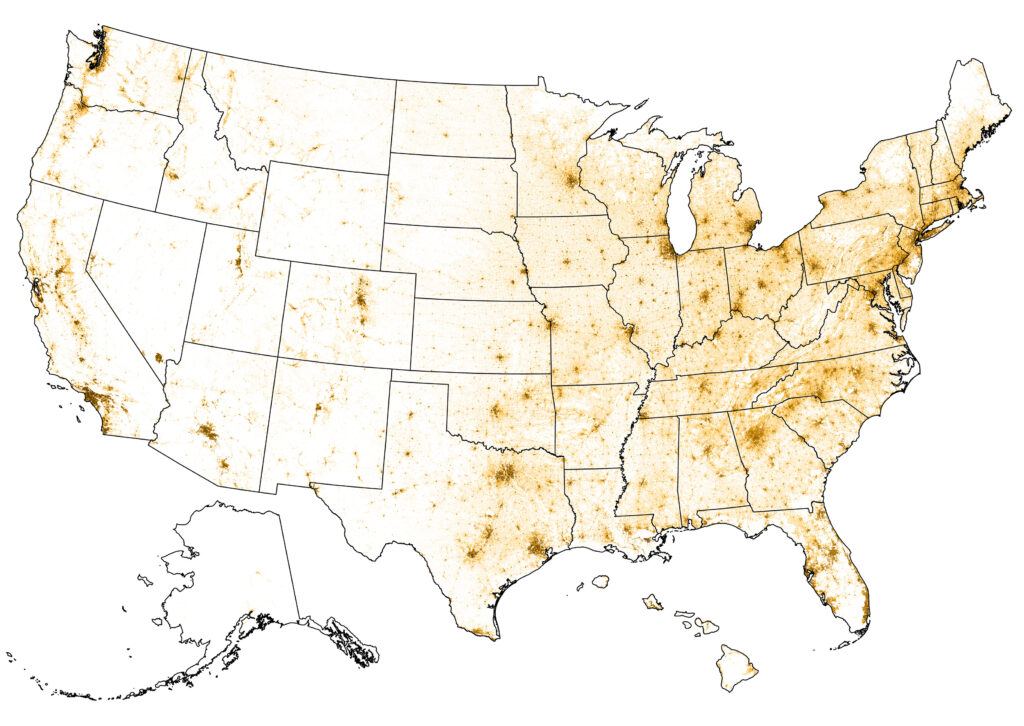
- Population Density: The approximate density of people living in each square kilometer. Spatial smoothing is applied to this layer to calculate density.
Buildings
Building layers are derived from building footprint datasets. They include buildings above a minimum size (40m2, or 430ft2) on habitable land area (not water or permanent ice and snow). There are three layers with information about buildings. Get these layers in the Research Data Archive.
- Building Count: The approximate number of buildings within a 30-meter pixel. No spatial smoothing is applied to this layer.
- Building Density: The approximate density of buildings per square kilometer. Spatial smoothing is applied to this layer to calculate density.
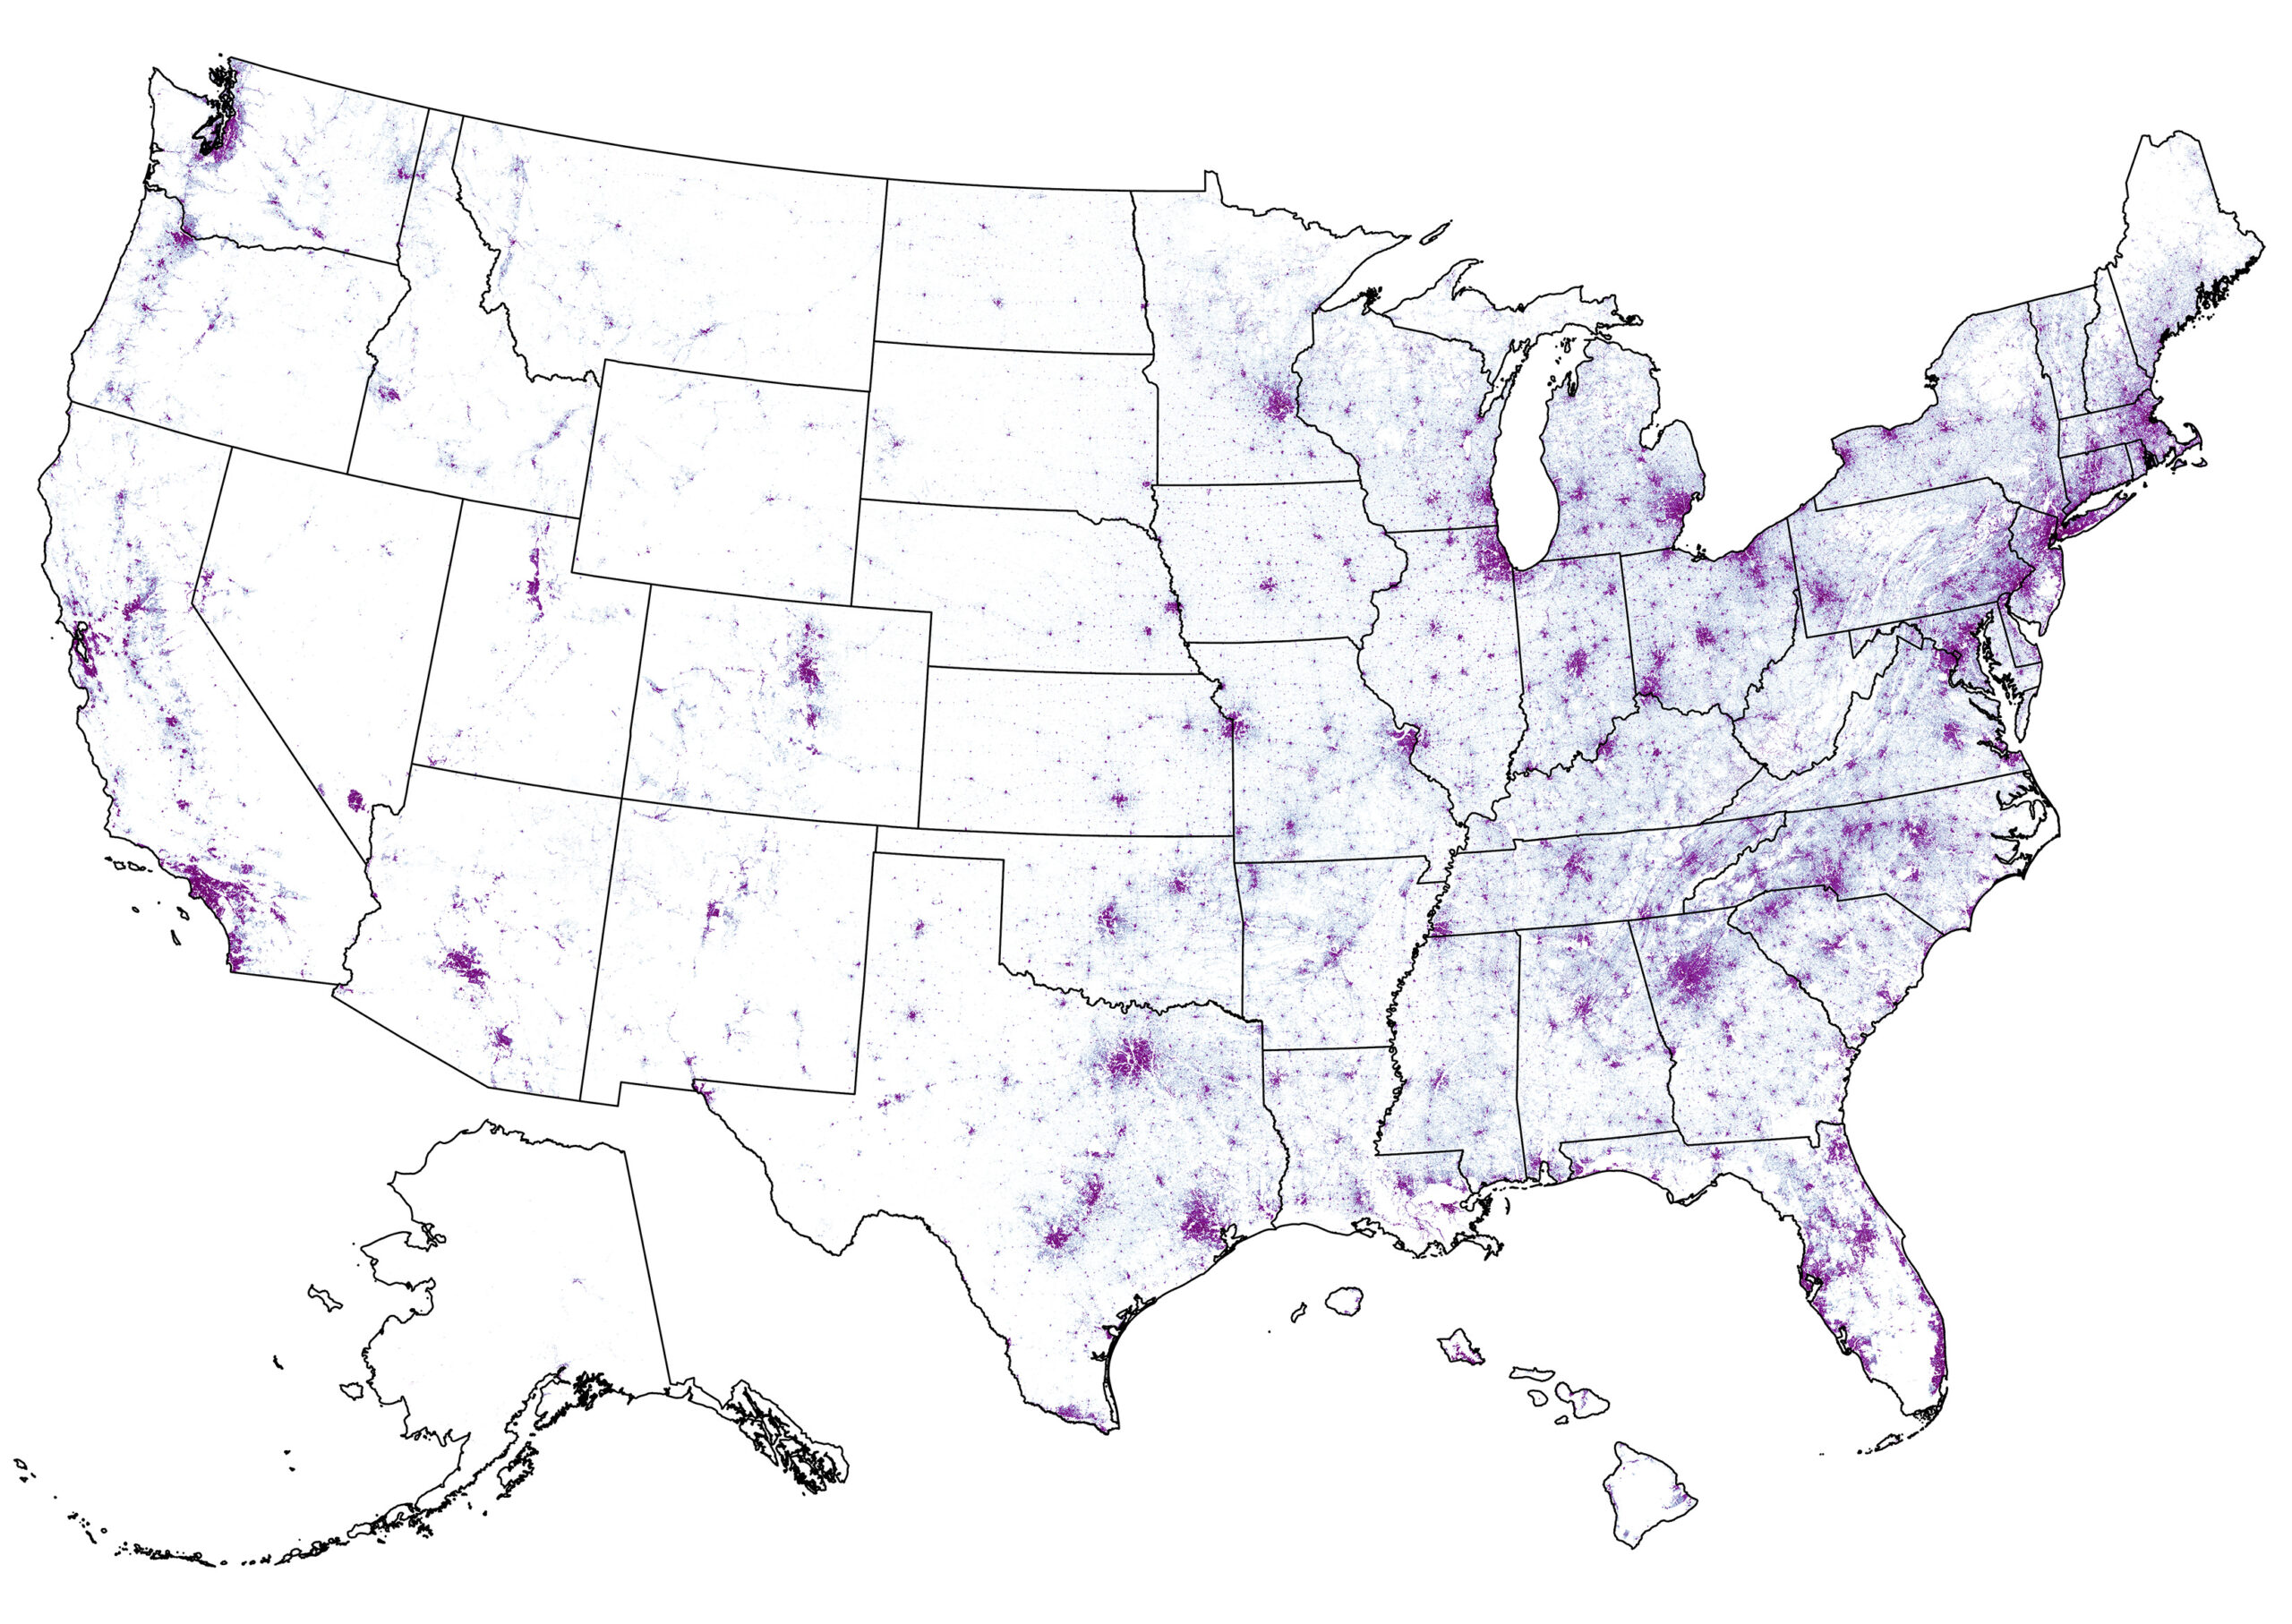
- Building Coverage: The percentage of habitable land area covered by building footprints with a roughly 5-acre area around each pixel.
Housing Units
Housing is defined as buildings that are likely to have occupants, according to building footprints and 2021 U.S. Census Bureau datasets. There are two layers with information about housing. Get these layers in the Research Data Archive.
- Housing Unit Count: The approximate number of housing units in each 30-meter pixel. No spatial smoothing is applied to this layer.
- Housing Unit Density: The approximate density of housing units per square kilometer. Spatial smoothing is applied to this layer to calculate density.
Housing Exposure & Risk
Three layers combine information about housing units and wildfire exposure or risk. Get these layers in the Research Data Archive.
- Housing Unit Exposure: The expected number of housing units within a pixel potentially exposed to wildfire annually. This integrates wildfire likelihood with housing density.
- Housing Unit Impact: The relative potential impact of fire to housing units at any pixel, if a fire were to occur. Like Wildfire Consequence above, this layer integrates wildfire intensity and generalized susceptibility of homes, and it also incorporates housing density. It does not include wildfire likelihood.
- Housing Unit Risk: This layer incorporates all primary elements of wildfire risk. It integrates wildfire likelihood and intensity with the generalized susceptibility of homes, and it also incorporates housing density.